Volatility Shocks and What Follows
Make sure you read my previous blog before this one. In that blog, I examined volatility: what it is, how we measure it, and how it usually behaves. In this blog I will take a look at useful tools for forecasting future volatility from the perspective of an active technical trader. In a soon-to-follow blog, I'll look at forecasting trend days, which is a particularly useful tool for daytraders. In all of this work, we'll see what can and cannot be done, and maybe gain an understanding of just how thin true edges are in the market.
In case you didn't heed the advice of the previous paragraph, a few words about why we care about this to begin: volatility is a measure of both risk and opportunity. Risk management paradigms tend to equate uncertainty with risk. More volatile markets move more, so it's tempting to say they are higher risk. This is true, but risk and opportunity are deeply intertwined; for skilled traders volatility may bring opportunity above and beyond the risk.
Options traders tend to be more aware of volatility, and it's important to separate two slightly different concepts that bear the word volatility. In these blog posts we are talking about the volatility of market prices. This may be labeled historical volatility, realized volatility, or statistical volatility.
Implied volatility is backed out from observed option prices and is relevant because it's a measure of what you're paying for the option. If you pay a certain implied volatility and the future volatility of the market is less than that volatility, you'll lose on trades (over a large sample size and all other things being equal.) Similarly, if the realized volatility of a market is higher than the implied, you have the potential to make money on trades.
This relationship is clearest on delta-hedged trades, but also carries over to, for instance, simple long puts or calls. Most options traders have experienced buying a call, seeing the market go up, and still losing money on the trade. Why? You overpaid on IV. Understanding the relationship between future volatility and current is essential, but, far too often, retail traders work off hopes, dreams, and vibes. (This is why professionals take your money, so let's figure out what we can do about that.)
Volatility Compression
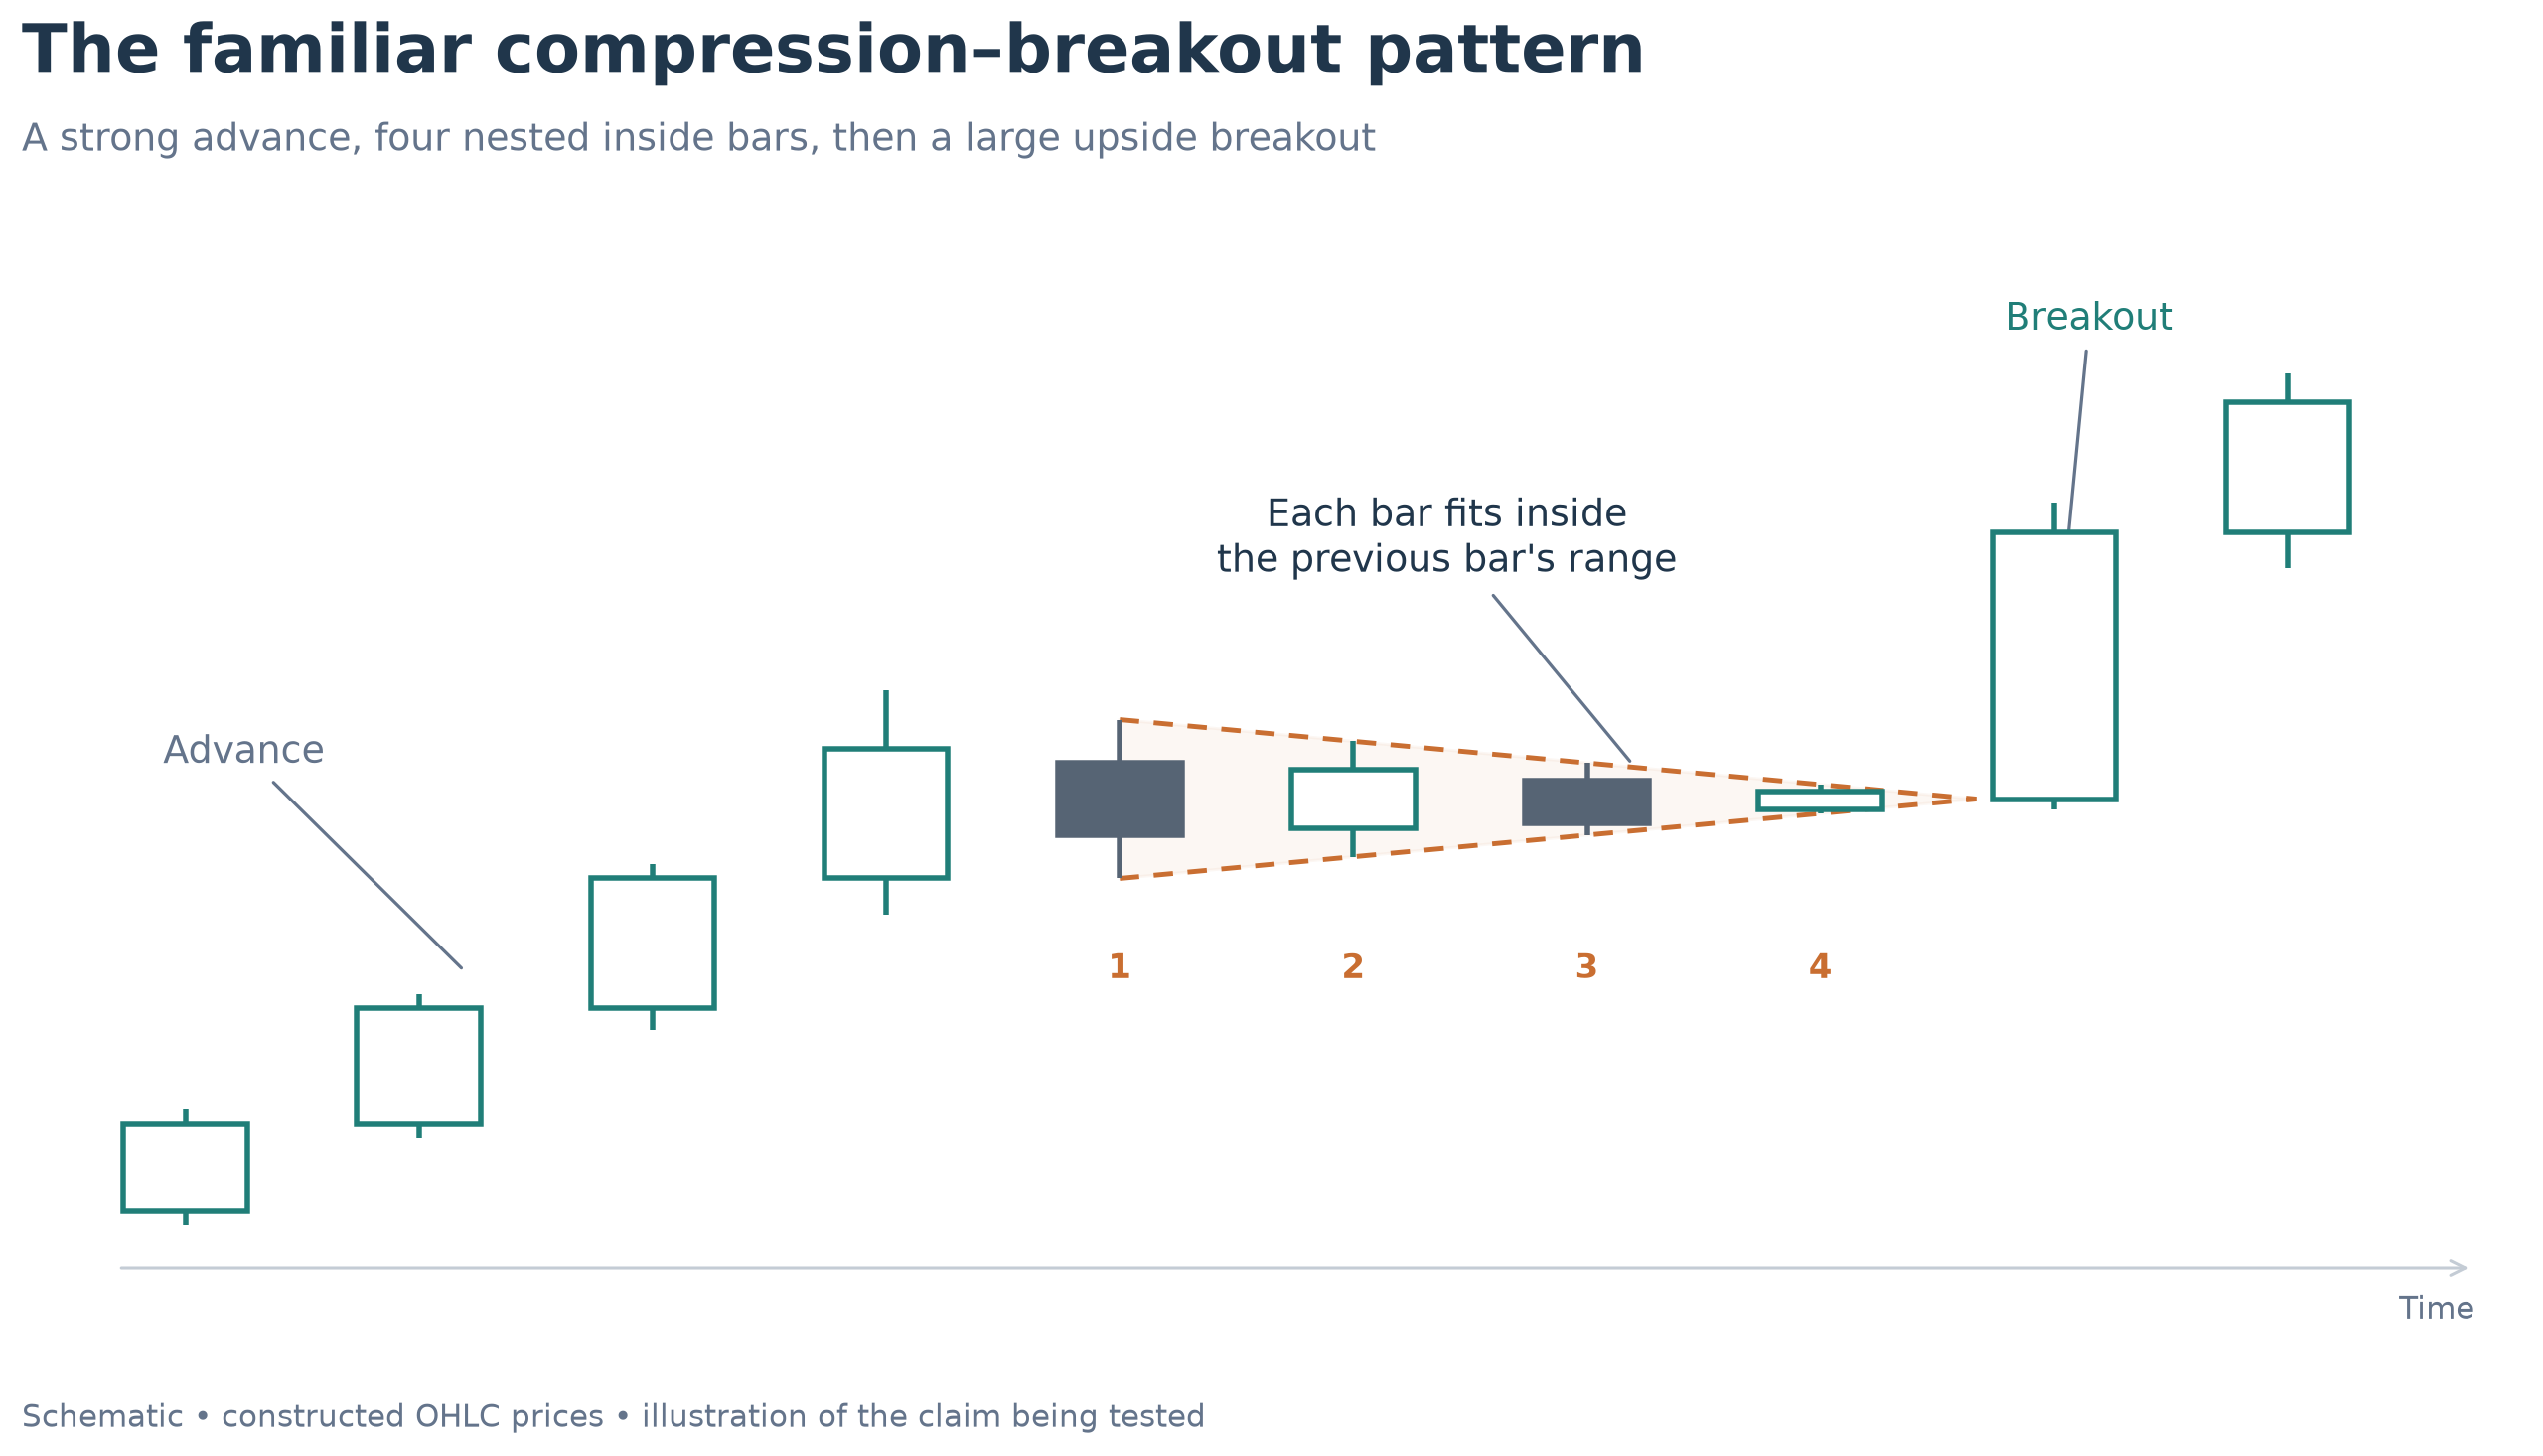
One of the long-standing claims of technical analysis is that low volatility leads to big moves. Technical analysis books are filled with charts like this:
[ graphic: show a market with a few big up trend bars reaching the middle of the chart and then a clear series of 4 bars where each bar is inside the other, making a triangle. then show a large breakout out of that area.]
Various vendors sell tools which center around ideas such as volatility squeezes, with the claim that watching markets with low current volatility leads to huge winning trades. A good question to ask of any trading idea is "does it work?" In this particular case, the answer is disappointing.
For one specific test, we looked at the ratio of 5 day ATR to 20 day ATR. Picking out the periods where this ratio was ≤0.75, we find that the next five sessions' average true range is only 0.8 times the current ATR20. Compare this to any random point (i.e., unconditional baseline) which has a forward volatility of 1.04 the current ATR20.
However, the forward-looking volatility is 1.23 times the current ATR5, a measure of short-term volatility. Comparing against the recent compressed baseline does show a tendency to return to the longer-term average level.
This is one quantification of many, and one valid critique might be that 5 and 20 are measuring somewhat similar volatilities. In Street Smarts (1995), Linda Raschke and Larry Connors used the ratio of the 6 to 100 day historical volatility (calculated from closing prices only). When this ratio is < 0.5 (intuitive read: "short-term volatility is less than half of what more typical volatility is") look-forward volatility is higher relative to recent volatility, but still below the longer-term baseline. In both cases, the read is that volatility can rebound from a low, compressed week, while still remaining well below its longer-term baseline.
Another interesting wrinkle is that the HVOL6 / HVOL100 ratio compression gives a forward ATR of 1.006 * ATR20. In this case, we're measuring a range outcome against a close-only volatility measure, and finding the range outcome right at baseline while the Hvol looks extremely compressed. How we measure matters.
There are many other ways to quantify this tendency, and the results will differ slightly between specifications. Across a reasonably wide range of tests, the results do not show a strong preference for big moves after volatility compression. Do not expect explosions after volatility compression.
In fact, narrow-range days generally lead to further narrow range days. Over the next five sessions following an NR7 (narrowest range of the past 7 bars), mean of true range / ATR20 is 0.924 (versus 1.04 for all data.) For NR5 and NR10, the forward-looking averages are 0.947 and 0.900, respectively. Tight range days tend to lead to more tight range days. Every technical analysis book shows this picture, with the expectation of what should follow, but this is simply not supported by the data.
Big Moves
Following large shocks, volatility typically backs off from the extreme level of the shock, but remains well above averages. This is an interesting symmetry to the compression case in which we saw volatility rising from its nadir but still remaining below longer-term levels.
Specifically, after a day with a TR (true range) > 2.5 ATR20, the following five sessions' mean true ranges average 1.71 the current ATR20 (including the shock bar), but only 0.6 times the shock bar's true range. In 70 of the 79 cases we examined, the future five-day average is smaller than the shock bar's range.
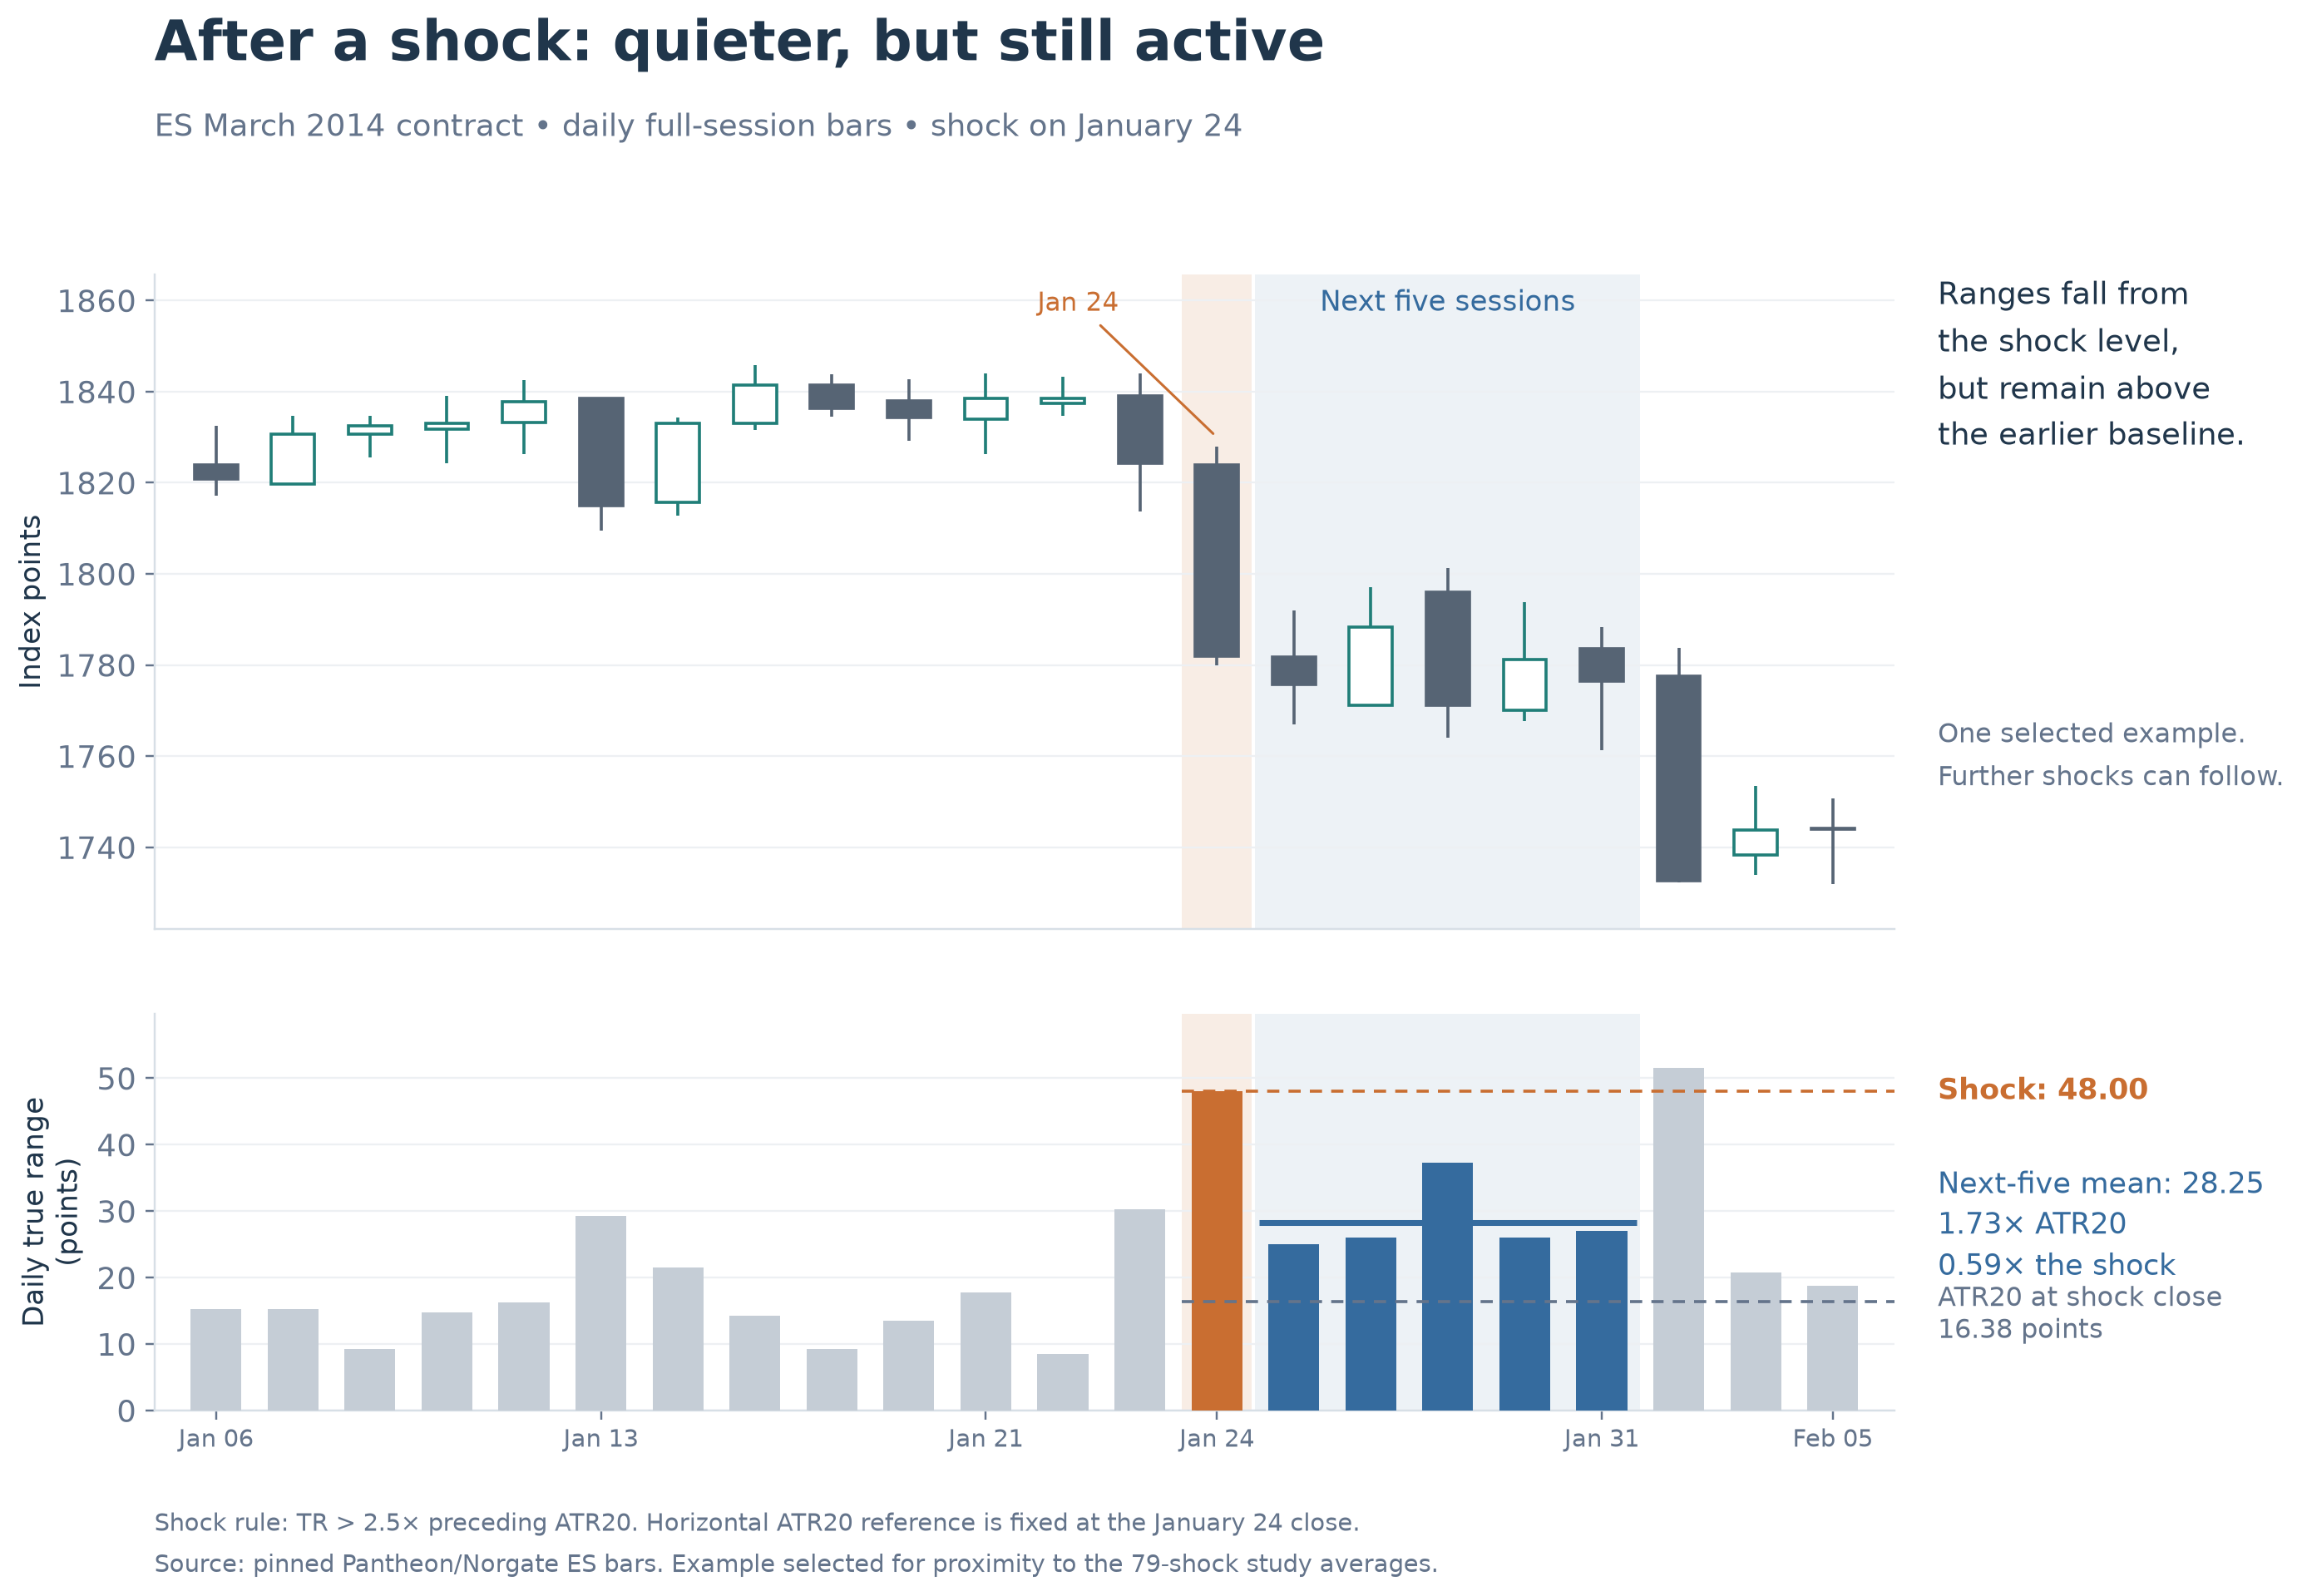
Two things can be true: volatility can both decline (from the shock level) and still remain elevated (relative to longer-term averages.) This is a similar tendency to what we saw in volatility compression. Thinking of both compression and big moves as extremes, there's a tendency to move toward normal volatility, while still remaining somewhat anchored near those extremes: Quiet markets will stay quiet, though perhaps less so than they are now. After a big move, expect the market to remain more volatile than usual, but to settle down from the extremes.
These are casual, conversational statements that might not fully capture the quantitative nuances of these tests. While some detail is lost, the operating framework will help discretionary traders avoid common mistakes: chasing volatility; buying breakouts in dull, dead markets; and generally being surprised by market behavior that is perfectly normal. The more closely we can align our expectations with what usually happens, the better traders we will be.
An Important Effect
Many things in the market are not symmetrical, and this is one of those things. A downward close in index futures adds roughly 0.2 * ATR20 to tomorrow's expected range, and 0.13 over the next five sessions. This is a small effect, but it's real and persistent in indexes. It is also an important refinement beyond "big moves lead to more volatility."
This effect is, however, different in different markets. A similar but smaller effect exists in individual stocks, and we find no effect at all in FX pairs. (This should make sense, as "up" and "down" depend entirely on how you quote the currency.) Some commodities actually show an inverted effect, with upward closes leading to larger ranges, probably because of supply concerns and inventory effects. Curiously, this effect in commodities tended toward the equity effect during the 2008-2009 financial crisis, likely reflecting a general tendency toward risk on/off trading. (All of these explanations are my own, off the cuff, and could be wildly wrong.)
If you are an active trader, you've probably sensed this effect even if you haven't quantified it. It also partially explains the persistent skew in equity options. Now you have an understanding that can help you shape future expectations for market action. At least in stocks, the market cares about which way it moved, not just how much it moved.
What Have We Learned?
This might seem like debunking after debunking, as we fail to find a simple trade that we can put on every day. Of course, this is not a realistic expectation. Be careful of incorrect assumptions based on casual reads of patterns. However, the work in this blog post has the potential to significantly improve your expectations. One of my volatility forecast models shows a reduction in log RMSE (a measure of how well the future matched a model forecast) from 0.366 to 0.303, incorporating several horizons, direction, and awareness of extremes. For options traders, this is a non-trivial improvement.
The raw nature of volatility might not tell us everything we need to know. Is it possible that cleaner moves might come after certain conditions and that this could have an impact on how we structure and manage trades? My next blog post will look at just this question.
Every word I've written above is my own. I use AI as a research assistant and line editor, but we do not publish AI-written text.
Having said that, my AI editor keeps me honest and wants me to remind you that these are statistical studies and exploratory results that do not establish entries, exits, or profitable trades, and to share this note on methods:
A note on the numbers: these come from daily full-session ES futures data, with signal dates running from January 4, 2010 through September 2026. ATR here is a simple average of true range, as in the previous post. Every condition is measured at a completed close, and the forward windows exclude the signal day itself — so nothing here uses information that wasn't available at the time. Those five-session windows overlap, which means the observations aren't independent of one another.