Chart of the Day: Russell 2000 Index
I tend to believe it's usually counterproductive to do too much in-depth technical analysis on different market cap or sector indexes. Everything is so tightly correlated anyway, so differences often become a matter of analyzing noise. Looking at retracement ratios and trendlines on these instruments and trying to make market calls is, largely, an exercise in futility--you can often get better information from a solid analysis of a single index.
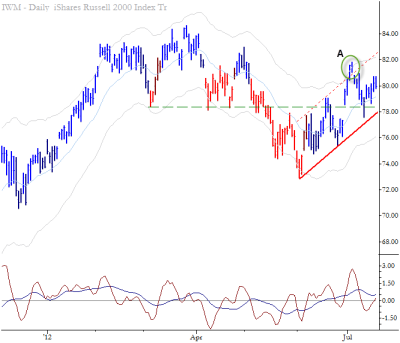
However, once you have derived a basic market call, sometimes it is most clear in a particular index. In this case, the Russell 2000 index (using the IWM here) shows the pattern most cleanly from a trade management perspective: the small parabolic exhaust above the parallel trendline, followed by a subsequent selloff and consolidation, sets the stage for a nice short entered on a weak close (or intraday.) Note also that we have been monitoring the R2k/S&P 500 spread; weakness there suggests more bang for your (short) buck in the midcaps compared to large caps, should the market sell off.