Patterns, Context, and a Clean Long in the S&P

Just a quick look at patterns and concepts applied in an actual trade. This was a trade that was shared with our MarketLife members in advance. Trades like this are easy, but only if you're looking in the right place at the right time.
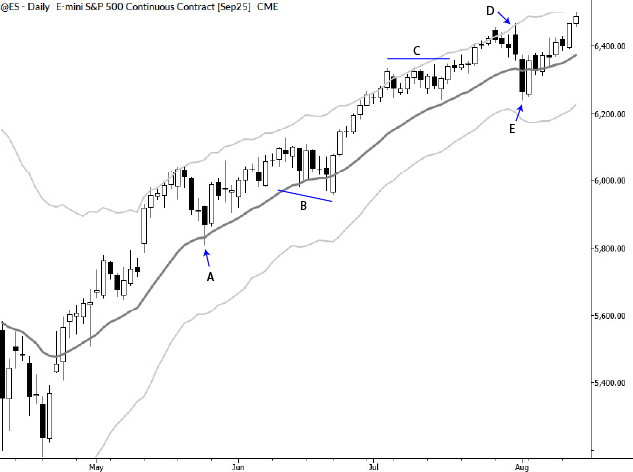
For context, trading has not been easy in many asset classes for much of this year (2025). Take a look at the chart below, which shows the S&P 500 futures through much of the summer. Some of the marked points refer to single bars (arrows), while others refer to areas or ranges (indicated by horizontal lines.)

Here's how I read this action:
A - A nice exhaustion following a pullback. Easy, classic entry in May.
B - This was a larger and more difficult range. Still tradable, but much back and forth and less price action clarity.
C - Another consolidation at highs. Though this market might not have given as as many entries as we wished, and there were more points of dissension, your focus should still be on finding areas to be long. Don't lose sight of the trend.
D - This single bar is not a great example of a failure test, mostly because it did not penetrate the previous high far enough. Regardless, this bar was a failure at ATH, and a sign for bulls to be cautious
E - Patterns come with expectations. We obviously don't expect every signal to lead to a 50% swing in every asset! The selloff from (D) was probably all that we could reasonably expect from that pattern. Now, this reversal complex tilts the scales back toward the upside.
It's very important to put all of this in context for your timeframe and trading/investing goals. If you're a longer-term investor, this is all noise--just focus on the uptrend and be long. If you're a shorter-term trader, some of these spots may have been a bit dangerous. There certainly was potential to get chopped up in these trades, but focusing on the overall trend gave important clarity.
Now, here's the trade setup:

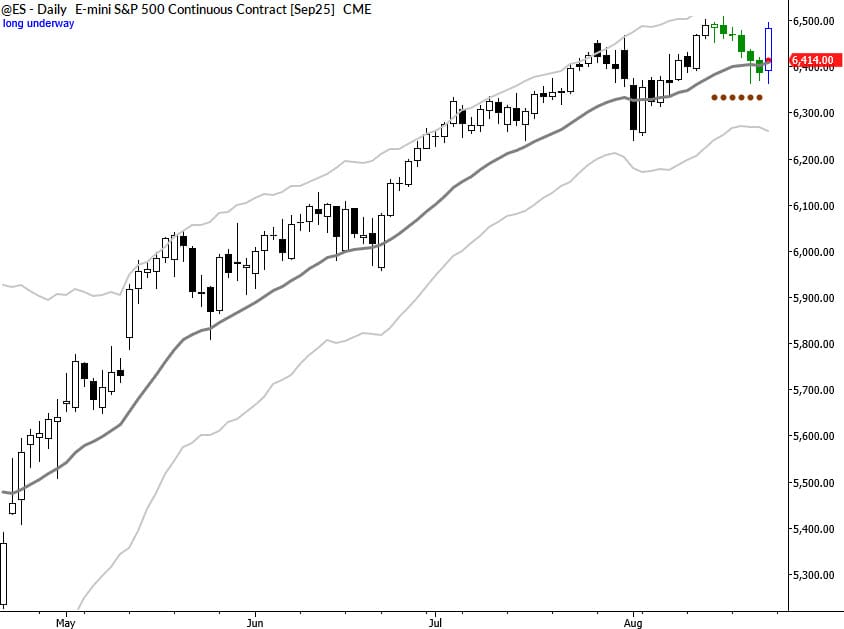
On 8/14/2025, we started looking for short-term long entries in indexes. (This spot is the beginning of the green area on the chart.)
Why look for a swing long entry here? There were a few factors, but the most important was simple: the market made new highs in the existing uptrend. This was momentum (moderate as it was) off the previous reversal complex, and removed some of our concerns about the market potentially chopping sideways.
The last bar on the chart shows Friday's action at the end of the week. Trading is always a process of moving from step to step, from each "known" to the next unknown. At this point, we're now looking to see whether the momentum can carry the market to new highs and a new trend leg up, and whether this will happen via consolidation or through clean momentum. There's also the possibility of failure--having these possibilities mapped out keeps the trader aware, alert, and ready to respond appropriately.
Trade management is another issue. We generally favor taking at least partial profits at very conservative targets, especially in potentially difficult market environments. Here, ringing the registers at 1R would lock in a profit on the trade in all but the most adverse gap down scenarios.
[edit: When I wrote this quickly this morning (8/25) it did not click that Tom and I actually executed in the Russell 2000 futures, which easily hit the 1R target. The S&P 500 futures did not hit 1R yet, but it was reasonable to move the stop to breakeven. Not as good of an outcome for this index, but we often consider setups in index futures to be largely (not always) tradable between different indexes.]
This is a simple application of trend integrity and pullback trading principles with some considerations for real world conflict. You can see more trades like this every week at MarketLife. I share daily work and analysis with our members, and connect patterns, context, and concepts with disciplined trade management in real time.


