From Noise to Signal: Building the Rvol Relative Volume Measure
In my previous post, I shared some perspectives on how I turned my lack of quantitative education into strengths. The structure that came from that process—not being afraid to get my hands dirty with the data, simulating multiple outcomes, and being willing to ask very basic questions—has served me well over the years.
A Changing World
When I was at SMB Capital around 2010, traders were trying to adapt to a new world. The 2008-2009 financial crisis had offered daily volatility and extreme opportunity for intraday stock traders. The new bull market was much more difficult. Traders were trying to figure out how to find stocks which offered opportunity as early as possible in the day.
Many of those traders did not have quantitative backgrounds. The obvious solutions were not bad: watch stocks that were in the news and keep an eye on stocks that had recently been in the news. Some traders even started combing the news before 6 AM New York time, in an effort to get a jump on other traders. I was suspicious of such approaches.
I had recently advised a group of traders who were working with early versions of lexical analysis—reading press releases against existing tone as analyzed from Yahoo! and other message boards of the day. I knew the human had little edge here if it were a game of speed; Silicon brains could parse news and language before the human eye could even read the words, so the game was already lost before it started. That is, if speed were all that mattered.
Activity Matters
It seemed more logical to me to make decisions based on what the market was doing. This type of data is always top-drawer for me—in trading, in fundamental analysis, and in macroeconomics—give me measures that show what people are doing or have done rather than what they think. I’d ignore a hundred sentiment surveys for one measure of activity.
And, in truth, there’s no clearer measure of activity than the changes of price and associated volume. People have voted, in aggregate, and have put their money and risk to work. The actions of noise traders (and I’ll say this to most daytraders—I’m looking at you) cancel out and, with the right analysis, we can sometimes see a spine of real intelligence and conviction through all the noise.
I have always been a bit suspicious of volume, mostly because it is highly correlated with range. If we look at both (and we cannot help but look at ranges if we look at charts), we risk double weighting an activity factor. I also knew that many of the approaches that leaned on volume were essentially opaque marketing tools. I knew a bit about the insider’s perspective on Market Profile, for instance—it was first offered to traders on the exchanges who weren’t interested and, despite intensive educational efforts, didn’t find any use of it. But it did find success once it was marketed to the public. And, today, its offspring are legion. Caveat emptor.
I was, however, aware that there were a few glaring anomalies around volume. Some of the strongest quantitative edges in stocks revolve around unusual volume. So, perhaps I had been too dismissive of volume, and perhaps this is an error I’ve held on to for too long. (Let this serve as a public apology if any of my work has hurt anyone by downplaying a volume factor you might have been looking into.)
My Toolkit at the Time
I was very well read in the literature of technical analysis, with a special emphasis on the early work. I knew that many of these writers held volume to be very important, but I also knew the world was very different now. For instance, when Wyckoff wrote about tape reading, one actually read a physical tape and could literally read every trade made in every stock that day. The market was orders of magnitude less active and simpler.
Here were the pieces of information that were bouncing around in my brain when I thought about volume:
- My own work in building screening tools and trading systems. I had discovered that the best reference for activity was a longer-term average of the level for each individual market (stock, futures contract, currency, option, etc.) I probably stole this idea from Linda Raschke or Larry Connors, but as they say, there’s nothing new under the sun.
- I knew Joe Granville’s OBV well, and had done quite a bit of work with it and other breadth-related concepts during the 2008-2009 bear market (without finding much useful here, to be fair.)
- I had played with the Dysart volume measures (still around, but not well known), but, again, had not found resounding success with them.
- I knew Laszlo Birinyi’s work well. His focus was not exactly on volume, but was centered around something he had branded Money Flow analysis—separating buyer and seller-motivated trades. I was fortunate to speak a bit with him, and he suggested that much of the edge had gone out of this approach since markets had evolved toward more electronic trading. My work found some overlapping edges when these ideas were combined with volume. These edges were confined to shorter timeframes and were not clear enough to trade, but it was another case of volume showing an edge in my work.
In the prop firm environment, it really was about finding stocks that were seeing unusual activity in the moment. Often, a stock would trade well for a day or even the next day, but it also wasn’t unusual to see a stock move well and then go into chop territory for the rest of the day. Doing your homework was not foolproof, because a stock that was boring for the first few hours of the day could suddenly become very active.
What was happening, of course, was that enough of an imbalance came into a specific market (a stock, in this case) to create some potentially tradable edges. In the absence of those kinds of imbalances, chop will prevail and you’ll probably get chopped up if you trade it.
Though I like to say I’m not a programmer, I did have some programming experience. I missed the punch card days, but I had experience all the way back to the assembly level—writing directly in hexadecimal for 6502 chips, long before modern languages and modern processors. Along the way, I’d dabbled in C++, but had proficiency in a few variants of BASIC. I’d also coded untold thousands of lines in TradeStation's EasyLanguage—my first version of that software was from Omega Research and came on floppy disks!
Two Ways
The shop was using fairly rudimentary charting software, but I had my TradeStation accounts so I used that to code a set of screens that would later be deployed as a commercial scanner. There’s a lot you can do with intraday data like this, but I focused attention on finding “in play” stocks in two specific ways.
The first was range-based: looking at stocks around previous days’ highs and lows, or looking for stocks that were already trading at a meaningful multiple of a longer average true range for that stock. (Again, adjusting every measure for the “baseline” activity level of each individual instrument.)
The way these measures evolve is not fully intuitive. One extremely common mistake is to size intraday trades in an active stock off a longer term average range. The thinking is something like, “This has already moved its average daily range; how much further can it go?” The correct answer is much further than you think. An active instrument is experiencing a regime shift and longer-term measures become less relevant. The game is in finding those active instruments.
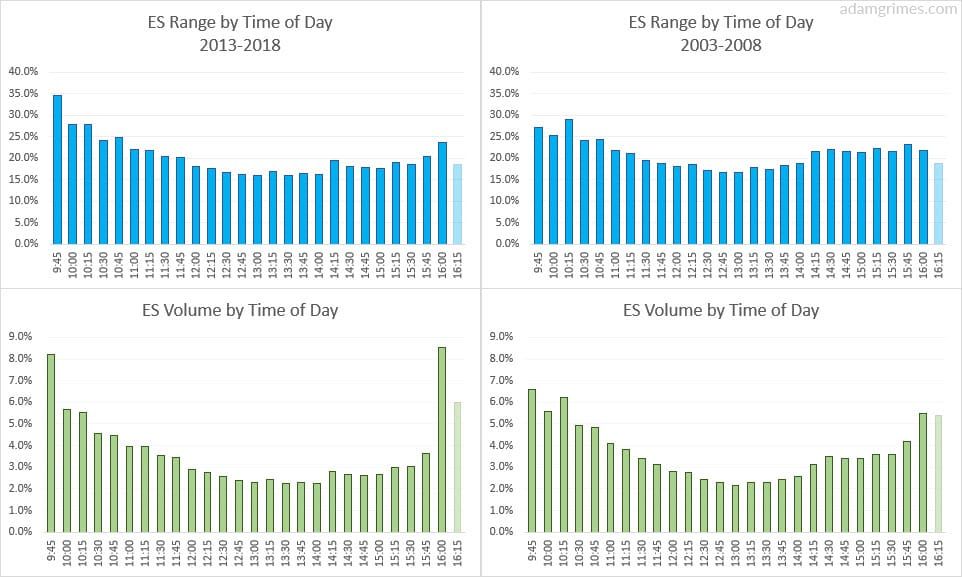
One interesting thing worth exploring is the idea that range does not evolve linearly throughout the day. In other words, if a stock is going to have a range of 1.00 for the day, you do not expect it to be showing a range of 0.25 when it is 25% of the way through a trading day. The math that describes this is fairly well known but requires some understanding of random walks and diffusion processes. Suffice it to say that it’s fairly easy to figure out what the expected range should be using percentage of trading hours completed as an input, so comparing the current range to that number is a good place to start.
With volume, you can do something similar. It’s well known (here, here, here, and here) that most of the volume is done in the first and last part of the day. Precisely how much is done in those sections is surprisingly consistent. So you have a possibility here of fitting a polynomial curve or a spline fit to the data and then measuring current volume against that.
That’s one approach, which has elegance and computational simplicity on its side. The other is to brute force it. This is a non-parametric approach that might be preferable to force-fitting a polynomial, since it will naturally capture any idiosyncrasies in each stock:
- Slice the trading day into a number of time slices (e.g., 1 minute, 5 minute, or 30 minute). (It's also possible to do this continuously, but then you're essentially slicing by seconds.)
- Go back over a period of time (How long? It matters…) and average the volume for each of those time windows.
- Compare the current volume against that longer term average and present it as a ratio.
- So, 1.0 means the stock is trading exactly along the path of average volume based on your lookback period.
There are a couple of things to consider here. First, your measure will be more reliable at the end of each time slice. (To understand this, imagine you are using very big time slices like two hours. How much volume do you think is done in the first minute of that slice compared to the 119th minute?) Doing smaller time slices is more data and computationally-intensive, but modern hardware makes this easy.
Other Considerations
The other is that the whole market changes each day. On a high volume day in the broad market, many stocks will naturally trade with higher volume. Be careful of using a fixed rule like “I’ll trade stocks that have a RVol > 3.0”. It’s worth either looking at a measure for the whole universe or at least considering something like index futures relative volume as an adjustment.
This is not a silver bullet. It will not solve any of your trading problems. Daytraders, just like any other group of traders, can spend a lot of time chasing a Holy Grail that does not exist. Be clear on what you expect from this tool: it will show you stocks that are moving. It will show you stocks that may have an imbalance of buying and selling pressure. It will show you where to focus your limited attention at any given time in the market. But it’s only part of the puzzle.
As I said before, there’s nothing new under the sun. There are only so many ways to slice and dice price data, and other firms had, of course, already considered measures like this. It’s not rocket science—there are only a few possible solutions for adjusting activity measures for time of day. The history of this tool had some interesting twists and turns as I watched from the sidelines. Several “gurus” marketed it as their own discovery, at least one semi-quant shop tried to brand it and run away with it, and interest in it has waxed and waned over the years.
It's been fun to see where my quantification of this concept has led, and I hope it’s been a useful contribution to the community. If you’re doing your own homework, it’s also worth considering how you can extend concepts of normalization and slicing to other measures and to relationships between markets. There may be some as-yet unexploited edges there.


