Chart of the Day: Consolidation Near Bottom of Range in Corn Futures
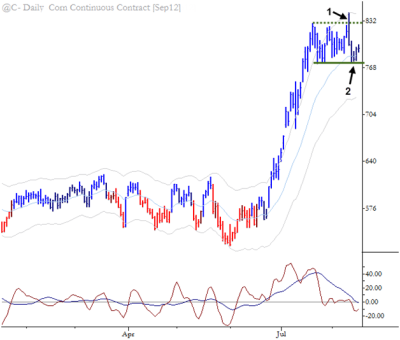
Two things to note on this chart of Corn futures: 1) The clean failure test above the summer's highs, followed by a sharp selloff to the bottom of the range. 2) Price is unable to rally strongly off of the support at the bottom of the range. This shows a lack of buying support, and sets up a good trade on a potential break below the bottom of the range. Note that this breakdown, should it occur, is another nail in the coffin of the summer's strong uptrend—this would be a serious challenge to trend integrity.
This is one of the advantages to understanding a set of trading patterns as I outline in the the book

. Whether you trade them as actual trades or not, they provide a good framework for market analysis and also give good insight into the balance of buying and selling pressure in the market at any time.// < ![CDATA[ // < ![CDATA[ <span style="overflow:hidden;line-height:0px" data-mce-style="overflow:hidden;line-height:0px" id="mce_0_start" data-mce-type="bookmark"> // ]]>