Chart of the Day
The volatility game
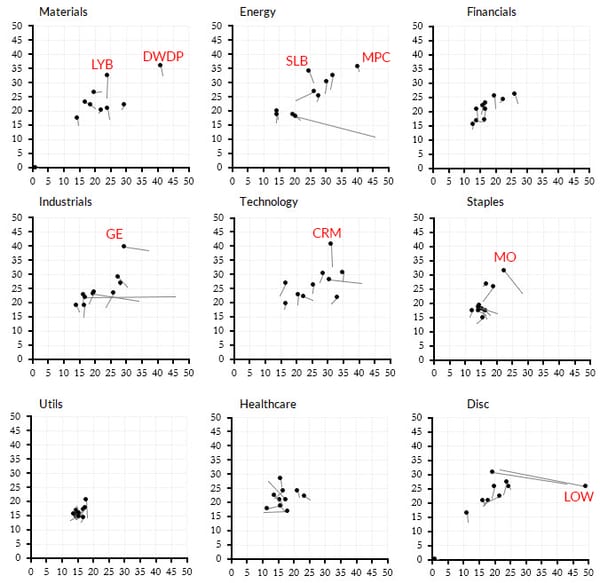
Take a look at the table of charts below. Each smaller chart shows the 10 largest stocks for that S&P 500 sector. They are graphed with historical (also called realized or statistical) volatility on the horizontal, and implied volatility on the vertical. The dot is the current value,